Blog
Email Marketing Attribution Models: How to Measure Multi-Touch ROI Across Campaigns
Learn how to accurately measure email revenue, compare single-touch vs multi-touch attribution models, navigate Apple MPP privacy changes, and track ROI.

> TL;DR: Email marketing attribution connects subscriber clicks and interactions to final revenue, downstream conversions, and customer lifetime value. While traditional metrics like open rate and click-through rate measure immediate engagement, attribution modeling answers which specific campaigns drove purchases. This guide breaks down single-touch and multi-touch email marketing attribution models, addresses privacy disruptions like Apple MPP, and provides a practical framework for implementing multi-channel revenue tracking.
Email marketing consistently generates one of the highest returns on investment in digital marketing, yet many growth teams struggle to measure its exact financial contribution. Standard email reporting dashboards track opens, clicks, unsubscribes, and deliverability rates. While these operational metrics are vital for monitoring list health and inbox placement, they fail to reveal how an automated welcome sequence, a promotional broadcast, or a triggered cart abandonment email actually influences a customer's final decision to buy.
When executive stakeholders ask whether email campaigns directly generate net-new ARR or simply claim credit for purchases that would have happened anyway, basic click tracking offers incomplete answers. Without a structured email marketing attribution framework, organizations risk underfunding high-performing lifecycle sequences or over-crediting aggressive discount campaigns that cannibalize organic margin.
Last updated: July 2026
What Is Email Marketing Attribution and Why Traditional Metrics Fail
Email marketing attribution is the methodology of evaluating subscriber touchpoints across the customer journey and assigning fractional financial value to specific email touchpoints that lead to a desired conversion event. Unlike top-of-funnel channels such as paid search or organic social, email operates across every stage of the funnel—from initial lead capture and nurture sequences to post-purchase cross-selling and churn prevention.
To understand why custom attribution modeling is necessary, it is essential to examine the fundamental limitations of relying solely on baseline campaign reporting metrics.
The Limits of Open Rates and Click-Through Rates
Historically, marketers relied on open rates as the primary proxy for campaign interest. However, baseline engagement metrics measure delivery and visual interaction, not commercial value:
- Open Rates Are Not Conversion Signals: An open indicates that an email client downloaded the header content and tracking pixel. It provides zero visibility into whether the subscriber read the content, trusted the brand, or intended to buy.
- Click-Through Rates Ignore the Extended Sales Cycle: Click-through rate (CTR) measures immediate link clicks within a single session. However, in B2B SaaS and high-consideration e-commerce, buyers rarely purchase immediately after clicking a link. The decision window often spans days or weeks, involving multiple visits across organic search, direct web traffic, and retargeting ads.
- Privacy Disruption: The widespread rollout of mailbox privacy features—most notably Apple’s Mail Privacy Protection (MPP)—automatically pre-loads tracking pixels in background proxies. This artificial inflation renders raw open rates completely unreliable as a signal of buyer intent.
To accurately evaluate campaign impact, growth teams must bridge the gap between email engagement data and downstream transactional data stored in their web analytics, CRM, or order management systems.
The Multi-Touch Customer Journey Reality
Modern buyers do not follow a linear path from signup to purchase. Consider a typical buyer journey for a subscription product:
- Day 1: A prospect signs up for a free resource after discovering a blog post via organic search. They receive a 5-part welcome automation sequence powered by Sendgrove Marketing Automation.
- Day 4: The subscriber clicks a link in Email #3 explaining a key product workflow, landing on a feature comparison page, but leaves without subscribing.
- Day 10: The prospect clicks a retargeting ad on LinkedIn and browses customer case studies.
- Day 14: The prospect receives a targeted broadcast newsletter introducing a limited-time credit bonus. They open the email on their mobile device, decide to purchase later from their desktop computer, and navigate directly to the pricing page.
If analytics tools rely strictly on last-click referral tracking, Google Analytics will credit the final purchase to "Direct" or "Organic Search," completely erasing the role played by the welcome automation and the promotional newsletter. Conversely, if an email platform claims 100% of the revenue because the subscriber clicked an email two weeks prior, the channel overstates its solo impact.
Implementing dedicated attribution modeling resolves this conflict by defining clear rules for how revenue credit is distributed across all participating marketing channels.
Single-Touch Email Attribution Models: First-Touch vs Last-Touch
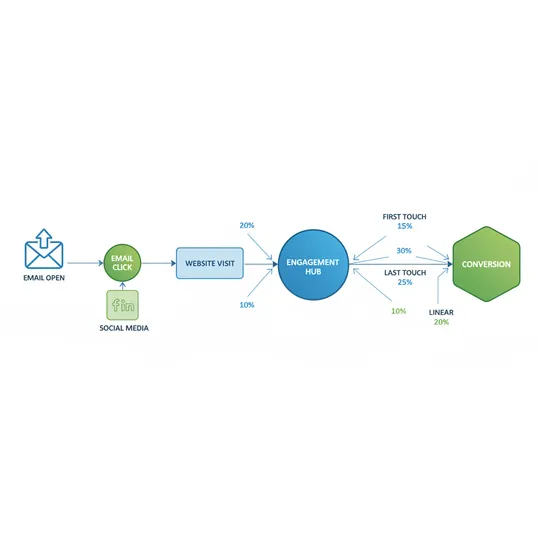
Single-touch attribution models assign 100% of the conversion credit to a single interactive touchpoint along the customer journey. While single-touch models simplify reporting and require less complex technical infrastructure, they provide an incomplete picture of multi-stage conversion funnels. Understanding when to use single-touch logic—and when to move beyond it—is the first step in building a mature reporting stack.
Single-Touch Model Credit Allocation

[ First Touch ] ──100% Revenue Credit──> (Initial Discovery / Signup)
[ Middle Touches ] ── 0% Revenue Credit──> (Nurture / Education / Case Studies)
[ Last Touch ]  ──100% Revenue Credit──> (Checkout / Final Purchase Click)
First-Touch Email Attribution
First-touch attribution assigns 100% of the conversion value to the very first point of contact between a subscriber and your brand. In the context of email marketing, first-touch credit is awarded to the lead capture channel or opt-in campaign that originally added the contact to your database.
- Mathematical Weighting: R_first = 1.0 * R_total, where R represents total order revenue.
- Primary Objective: Measure lead acquisition efficiency and content offer performance.
- Best Use Case: Evaluating which lead magnets, landing page signups, or co-marketing offers generate long-term paying customers vs. unengaged subscribers.
#### Strengths of First-Touch Modeling First-touch attribution provides clear visibility into top-of-funnel acquisition channels. By tracking cohort revenue back to the original signup source, acquisition managers can identify which lead generation campaigns attract buyers with high lifetime value (LTV). For instance, if subscribers joining via a technical webinar sequence convert at a 4x higher rate over 90 days than subscribers from a generic discount popup, first-touch modeling highlights where to scale ad spend and list-building budgets.
#### Weaknesses of First-Touch Modeling First-touch modeling completely ignores all subsequent nurturing, automated trigger flows, and sales calls that took place between opt-in and purchase. If a subscriber joins a list, receives 20 educational newsletters over 6 months, attends a live demo, and finally clicks a promotional link to buy, first-touch attribution credits 100% of the sale to the initial lead magnet popup. This creates a structural reporting bias that systematically undervalues mid-funnel education and retention automations.
Last-Touch Email Attribution
Last-touch attribution (often called last-click attribution) awards 100% of the conversion credit to the final touchpoint that occurred immediately before the conversion event took place.
- Mathematical Weighting: R_last = 1.0 * R_total.
- Primary Objective: Measure immediate campaign response and direct promotional drive.
- Best Use Case: High-velocity e-commerce sales, flash promotions, and short-cycle transactional offers where purchases occur in a single web session immediately following an email click.
#### Strengths of Last-Touch Modeling Last-touch modeling is straightforward to implement and align across Google Analytics and standard e-commerce platforms. Because it focuses strictly on the immediate session referral, last-touch attribution accurately answers which specific email subject line, call-to-action, or promotional offer triggered an instant purchase decision. It eliminates ambiguity when measuring time-sensitive sales campaigns.
#### Weaknesses of Last-Touch Modeling Last-touch attribution penalizes channels that build initial brand awareness and trust. In B2B SaaS and high-ticket B2C, a prospect may read ten educational articles and open five automated onboarding emails before searching for your brand name directly to purchase. Last-touch attribution credits 100% of the transaction to "Direct Traffic" or "Brand Search," making email marketing appear completely ineffective when evaluated in isolation.
Last-Email-Touch (Channel-Specific) Attribution
To address the limitations of cross-channel last-touch models, many email platforms utilize a "Last-Email-Touch" lookback window (typically 1 to 30 days). Under this model, if a customer makes a purchase and clicked an email anytime within the lookback window, the email channel claims 100% credit for the sale—even if the customer subsequently clicked a paid ad or entered the site directly.
While Last-Email-Touch ensures that email receives recognition for influencing sales, marketing teams must compare this internal platform data against multi-channel analytics platforms to avoid double-counting revenue across ad platforms, affiliate partners, and organic search.
Multi-Touch Email Attribution Models: Linear, Time-Decay, and Position-Based
Multi-touch attribution (MTA) distributes conversion value across multiple touchpoints along the buyer journey according to predetermined rules or algorithmic machine learning models. By accounting for every touchpoint—from initial opt-in and automated nurturing to final promotional clicks—MTA offers a balanced, comprehensive perspective on marketing performance.
Multi-Touch Credit Distribution Comparison

Linear Model:         [20%] ─── [20%] ─── [20%] ─── [20%] ─── [20%]
Time-Decay Model:     [05%] ─── [10%] ─── [15%] ─── [30%] ─── [40%]
U-Shaped (Position):  [40%] ─── [06.6%] ── [06.6%] ── [06.6%] ── [40%]
W-Shaped (Position):  [30%] ── [30% Opp] ── [10%] ── [10%] ── [20% Sale]
Linear Attribution
The linear attribution model divides credit equally among all recorded interactions leading up to a conversion. If a customer interacts with 5 touchpoints prior to purchasing a $500 subscription, each touchpoint receives $100 in attributed revenue.
- Mathematical Formula: R_i = (R_total / N), where N represents the total number of touchpoints, and R_i represents credit assigned to touchpoint i.
- Best Use Case: Long B2B sales cycles with consistent, multi-month engagement across content marketing, automated lifecycle flows, and personal sales outreach.
#### Advantages for Email Marketers Linear attribution ensures that every email campaign, newsletter, and automated sequence that a subscriber interacts with receives recognition. It prevents mid-funnel content—such as educational guides, customer success stories, and product updates—from being overlooked simply because they do not sit at the extreme ends of the funnel.
#### Disadvantages Linear attribution treats every touchpoint as equally valuable, regardless of impact. A routine monthly newsletter click receives the exact same financial credit as an emergency transactional notification or a high-converting sales demo booking. This uniform distribution can artificially inflate low-impact touchpoints while obscuring the true catalysts of revenue growth.
Time-Decay Attribution
Time-decay attribution applies an exponential decay algorithm that awards increasing revenue credit to touchpoints that occur closest in time to the conversion event. Touchpoints experienced weeks prior receive minimal credit, while interactions occurring hours or days before purchase receive the largest share.
- Mathematical Formula: W(t) = 2^(-t / lambda), where t is the time elapsed before conversion, and lambda is the half-life parameter (commonly set to 7 days).
- Best Use Case: Consideration cycles where customer interest builds progressively toward a planned purchase decision, such as annual SaaS renewals, high-end e-commerce, or professional services.
#### Advantages for Email Marketers Time-decay modeling aligns closely with natural consumer behavior. While initial welcome emails build foundational awareness, the urgency-driven abandonment flows and product comparison campaigns sent immediately prior to checkout play a more decisive role in closing the sale. Time-decay appropriately rewards these high-intent closing emails without completely erasing top-of-funnel contribution.
#### Disadvantages By heavily weighting recent interactions, time-decay models systematically undervalue early-stage lead generation and brand discovery. If an exceptional lead magnet sequence captures high-value prospects who require a 60-day consideration period, time-decay attribution will assign near-zero credit to the initial lead capture campaign.
Position-Based (U-Shaped & W-Shaped) Attribution
Position-based attribution models combine the strengths of single-touch and multi-touch logic by heavily weighting key inflection points along the conversion path while distributing remaining credit across intermediate touchpoints.
#### U-Shaped Attribution (2-Point Anchor) The U-shaped model focuses on two critical conversion milestones: the first touchpoint (brand discovery) and the lead creation touchpoint (opt-in/registration).
- Credit Allocation: 40% to First Touch, 40% to Lead Conversion Touch, and 20% divided equally among all intermediate nurturing touchpoints.
- Best Use Case: Demand generation teams focused on evaluating lead capture mechanisms and immediate onboarding sequences.
#### W-Shaped Attribution (3-Point Anchor) The W-shaped model expands U-shaped logic to accommodate B2B sales funnels that track contacts through sales opportunity creation.
- Credit Allocation: 30% to First Touch, 30% to Lead Creation, 30% to Opportunity Creation, and 10% divided among intermediate touchpoints.
- Best Use Case: Enterprise SaaS and complex B2B sales organizations utilizing integrated CRM tracking across marketing automation and sales pipelines.
Position-based models are widely considered the gold standard for lifecycle email marketing because they explicitly acknowledge that capturing a subscriber's email address and converting them into a paying customer are the two most critical events in the revenue pipeline.
Data-Driven (Algorithmic) Attribution
Data-driven attribution leverages machine learning algorithms (such as Shapley Value analysis or Markov Chain modeling) to evaluate historical conversion paths against non-converting paths. By mathematically measuring how the presence or removal of a specific email flow alters conversion probability, algorithmic models dynamically calculate the true incremental value of every campaign.
While data-driven attribution eliminates human bias in credit weighting, it requires high data volume (typically thousands of monthly conversions) and advanced data warehousing infrastructure.
To evaluate campaign efficiency across lifecycle stages, marketers often pair custom attribution modeling with comprehensive performance auditing as outlined in our Email Marketing Audit Playbook.
How Apple Mail Privacy Protection (MPP) Broke Open-Based Attribution
In September 2021, Apple released iOS 15, iPadOS 15, and macOS Monterey, introducing Mail Privacy Protection (MPP) for users of the native Apple Mail app. MPP fundamental altered how email analytics tools gather engagement data, rendering open-based attribution models obsolete overnight and forcing marketers to rebuild their attribution architecture around verifiable zero-party and first-party interactions.
Apple MPP Privacy Proxy Architecture

[ Sendgrove Platform ] ──> Sends Email with Tracking Pixel
                                   │
                                   ▼
[ Apple Proxy Server ] ──> Automatically Downloads All Assets (Fakes Open: 100%)
                                   │
                                   ▼
[ User Inbox ] ──────────> User Reads or Ignores Email (Real Action Invisible)
The Mechanism of Apple MPP
When an Apple Mail user enables Mail Privacy Protection, Apple routes all incoming emails through multi-stage proxy servers before delivering them to the device inbox. During this proxy routing process, Apple's servers automatically download all remote content, including embedded 1x1 tracking pixels, regardless of whether the recipient ever opens or views the message.
This mechanism produces three major technical distortions:
- Inflated Open Rates: Every email delivered to an MPP-enabled inbox registers an instant "open" signal from Apple's proxy IP address. Open rates across lists with high mobile Apple Mail adoption frequently artificially spiked to 60–80%.
- Obfuscated IP Addresses and Geolocation: Apple routes traffic through regional proxies, hiding the recipient’s true IP address. Localized campaign attribution based on open locations becomes inaccurate.
- Erased Device and Client Signatures: Proxy pre-loading obscures device user agents, making it impossible to determine whether an open occurred on an iPhone, iPad, or desktop Mac.
Impact on Lookback Windows and Engagement Scoring
The artificial open signals generated by Apple MPP severely corrupted legacy attribution methodologies that relied on open-based engagement scoring:
- Corrupted Re-Engagement Automations: Legacy sunset policies that automatically unsubscribed users after "90 days of no opens" failed because MPP proxy opens masked inactive, disengaged subscribers. Unengaged contacts remained on active lists, gradually eroding sender reputation and deliverability rates.
- Flawed Open-Touch Lookback Windows: Attribution tools that utilized "open lookback windows" (e.g., crediting an email if the user opened it within 7 days of buying) began incorrectly attributing massive volumes of organic and paid web sales to email, creating duplicate, false revenue credit.
- Broken Subject Line A/B Testing: Automated A/B testing frameworks configured to select winning subject lines based on 2-hour open rates were essentially measuring Apple proxy caching speed rather than human psychological response.
Transitioning to Click-Based and Conversion-Based Attribution
To maintain accurate financial reporting in a post-MPP environment, deliverability specialists and analytics leaders must enforce strict first-party behavioral metrics across their attribution stack.
#### 1. Standardize on Verifiable Click-Through Events Clicks remain completely immune to MPP proxy pre-loading. A click requires a deliberate human action—clicking a hyperlinked CTA button or text link—that routes through web tracking servers. Transition all attribution lookback triggers from "Last Open" to "Last Click."
#### 2. Implement First-Party UTM Taxonomy Ensure every link generated within your email platform automatically appends standardized UTM parameters. Consistent parameter structure allows web analytics systems (such as Google Analytics 4 or custom data warehouses) to clean, categorize, and join email traffic against downstream order tables:
utm_source:sendgrove(identifies the messaging infrastructure)utm_medium:email(identifies the communication channel)utm_campaign:welcome_sequence_v2orjuly_flash_sale(identifies the specific sequence or broadcast)utm_content:cta_button_topvstext_link_footer(identifies variant positioning)
#### 3. Leverage Real-Time Webhook Signals Rather than relying on periodic API polling or pixel tracking, modern stacks stream real-time click and conversion webhooks directly from the email engine into centralized analytics platforms.
When managing list health alongside attribution tracking, marketers can leverage hygiene practices detailed in our Email List Decay Guide to prune invalid contacts before they distort performance metrics.
Step-by-Step Technical Setup for Accurate Email Campaign Revenue Tracking and ROI
Building an enterprise-grade email attribution system requires aligning four core technical components: consistent link tagging, web session tracking, server-side conversion logging, and data synchronization. The following step-by-step implementation guide outlines how to establish an end-to-end tracking pipeline.
End-to-End Technical Data Pipeline

[ Email Link Click ] ──(UTM Params)──> [ Web Landing Page ]
                                              │
                                       (First-Party Cookie)
                                              │
                                              ▼
[ Conversion Event ] ──(Server API)──> [ Analytics Warehouse / Sendgrove ]
Step 1: Standardize Global UTM Link Tagging
Every outbound email link must automatically append standardized UTM parameters. Manual URL building leads to typos, casing discrepancies (e.g., mixing Email and email), and missing parameters that corrupt reporting databases.
Configure your ESP setting to automatically append global parameters to every link:
https://yourdomain.com/landing-page?utm_source=sendgrove&utm_medium=email&utm_campaign={{campaign.name}}&utm_content={{link.id}}&sf_contact_id={{contact.id}}#### Parameter Breakdown
sf_contact_id: A unique, hashed subscriber identifier passed in the URL. This enables web analytics scripts to map anonymous web browsing sessions back to a specific subscriber profile once a conversion occurs.utm_campaign: The exact internal slug of the email campaign or automated flow step (e.g.,welcome_flow_step_2).
Step 2: Implement First-Party Web Analytics Tracking Pixels
When a subscriber clicks an email link and lands on your website, your front-end analytics script (such as Google Analytics 4, Segment, or a custom event tracker) must capture the incoming URL parameters and persist them across the user's browsing session.
Because modern browsers restrict third-party cookies, store attribution parameters in first-party browser storage (localStorage or document.cookie) set on your root domain:
// Sample script to capture and persist email attribution parameters
(function captureEmailAttribution() {
  const urlParams = new URLSearchParams(window.location.search);
  const source = urlParams.get('utm_source');
  const medium = urlParams.get('utm_medium');
  const campaign = urlParams.get('utm_campaign');
  const contactId = urlParams.get('sf_contact_id');

if (source && medium) {
    const attributionData = {
      utm_source: source,
      utm_medium: medium,
      utm_campaign: campaign || 'none',
      sf_contact_id: contactId || 'anonymous',
      timestamp: new Date().toISOString()
    };

// Store in first-party cookie valid for 30 days
    document.cookie = "sf_email_attribution=" + encodeURIComponent(JSON.stringify(attributionData)) +
                      "; max-age=" + (30 * 86400) + "; path=/; SameSite=Lax";
  }
})();
Step 3: Configure Server-Side Conversion API Events
Client-side JavaScript trackers can be blocked by ad blockers, network timeouts, or browser privacy extensions. To ensure 100% data integrity for financial attribution, pass conversion events directly from your backend server or checkout engine (such as Shopify, Stripe, or custom billing systems) to your analytics warehouse.
When a customer completes a checkout or upgrades a subscription:
- Extract the
sf_email_attributioncookie from the incoming HTTP request header. - Read the stored
sf_contact_idandutm_campaignvalues. - Attach those attribution values to the transaction payload logged in your analytics database.
Step 4: Integrate First-Party Data with Sendgrove Analytics
By syncing transactional conversion events back into Sendgrove Campaign Analytics, marketing teams gain real-time visibility into campaign ROI directly within their broadcast dashboard.
Sendgrove’s reporting interface automatically pairs delivery metadata with synced revenue webhooks, displaying key metrics:
- Revenue per Email (RPE): Total generated revenue divided by total delivered messages.
- Conversion Rate per Campaign: Percentage of link clicks that resulted in a completed checkout.
- Customer LTV by Acquisition Cohort: Long-term net revenue generated by subscribers acquired through specific lead capture forms.
By combining campaign analytics with smart list segmentation tools in Sendgrove Audience Segmentation, growth teams can automatically segment buyers based on past purchase value and trigger automated cross-sell campaigns.
For teams looking to optimize click-through conversions prior to checkout, review our operational guide on How to Increase Email Click-Through Rates.
5 Common Email Attribution Pitfalls and How to Fix Them
Even well-funded marketing teams frequently make critical analytical errors when interpreting email attribution reports. Recognizing these common pitfalls prevents flawed strategic decision-making and ensures that budget allocations reflect true incremental business growth.
Pitfall 1: Over-Crediting Discount Campaigns
A major reporting trap occurs when last-touch attribution models award massive revenue credit to broadcast discount emails sent right before cart expiration.
#### The Problem Subscribers who have already decided to purchase frequently wait for a promo code or search for a discount email right before checking out. When last-touch attribution attributes 100% of these sales to the discount email, it creates the illusion that heavy discounting is driving business growth. In reality, the email merely lowered profit margins on purchases that were already guaranteed to happen.
#### The Remediation Run incrementality testing (A/B holdout groups) where 10% of active cart abandoners receive no discount email while 90% receive the promo flow. Compare net margin across both groups to measure the true incremental revenue lift generated by the promotion versus base conversion rates.
Pitfall 2: Ignoring Cross-Device Path Disruption
Subscribers frequently read promotional emails on mobile devices while commuting or taking work breaks, but complete high-consideration purchases later from desktop browsers or work laptops.
#### The Problem If web session tracking relies strictly on single-session browser cookies without matching user accounts or persistent subscriber IDs (sf_contact_id), the desktop purchase appears as "Direct" or "Organic Search." The mobile email interaction that initiated the purchase decision is completely disconnected from the transaction.
#### The Remediation Utilize persistent subscriber identity resolution. Require users to log in, or pass hashed contact identifiers in email links that tie mobile browser sessions and desktop user profiles back to a single customer record in your CRM.
Pitfall 3: Failing to Account for Email List Validation and Hygiene
Attribution calculations assume that every message dispatched by an email engine reaches an active recipient inbox. However, high bounce rates and toxic spam traps severely skew delivery data, distorting revenue-per-email (RPE) formulas.
#### The Problem If an uncleaned list of 100,000 contacts contains 15,000 hard bounces and invalid addresses, sending a campaign to the entire list reduces overall deliverability, causes mailbox providers like Gmail to throttle delivery, and dilutes calculated RPE metrics.
#### The Remediation Integrate automated list hygiene directly into your subscriber onboarding workflow. By verifying incoming contacts using Sendgrove Email Validation, teams ensure that invalid addresses, temporary disposable emails, and spam traps are filtered before campaigns deploy. Maintaining clean deliverability protects domain reputation and ensures that attribution calculations reflect genuine subscriber interactions.
List Hygiene Impact on Attribution Metrics

[ Raw List: 100k ] ──(No Verification)──> 15% Bounces ──> Throttle ──> Skewed Low RPE
[ Verified List ]  ──(Sendgrove API)────> 0.1% Bounce ──> Inbox ────> True Accurate RPE
Pitfall 4: Short Lookback Windows in High-Ticket Cycles
Setting a standard 1-day or 7-day attribution lookback window works well for impulse e-commerce products, but fails completely in enterprise SaaS, B2B consulting, or high-end retail.
#### The Problem If a buyer receives a comprehensive product comparison email, forwards it to internal buying stakeholders, and completes a $10,000 contract 18 days later, a 7-day lookback window assigns $0 credit to the email campaign.
#### The Remediation Customize your attribution lookback windows based on average sales cycle duration. In B2B SaaS, extend lookback windows to 30, 60, or 90 days, or implement multi-touch position-based models (W-Shaped) that account for prolonged consideration windows.
Pitfall 5: Double-Counting Revenue Across Advertising Channels
When every marketing platform operates in isolation, internal dashboards claim duplicate credit for the exact same transaction.
#### The Problem If a customer clicks a Facebook ad, reads a Sendgrove nurture email, and clicks a Google retargeting ad before making a $200 purchase:
- Facebook Ads dashboard claims $200
- Sendgrove dashboard claims $200
- Google Ads dashboard claims $200
Total reported revenue across channel dashboards reads $600, while actual bank revenue is only $200.
#### The Remediation Establish a centralized multi-channel attribution model in a unified business intelligence tool (like GA4, Looker, or Triple Whale). Force the sum of attributed revenue across all channels to equal 100% of actual store transactions.
Comparing Email Marketing Attribution Models
Selecting the appropriate attribution model depends on your business model, average order value, technical infrastructure, and sales cycle length. The table below compares the primary email attribution models across key operational criteria.
| Attribution Model | Primary Credit Focus | Technical Complexity | Best Lifecycle Stage | Ideal Business Fit | | :--- | :--- | :--- | :--- | :--- | | Sendgrove First-Party Multi-Touch | Balanced multi-point weighting (First, Opt-In, Closing) | Low–Medium (Native Sendgrove Webhooks + GA4) | Full Lifecycle (Lead Capture → Conversion) | SMB, E-Commerce & Growing SaaS | | First-Touch | 100% to initial discovery / lead magnet | Low | Top of Funnel (Lead Generation) | Content Creators & Lead Magnet Campaigns | | Last-Touch (Last-Click) | 100% to final link click before checkout | Low | Bottom of Funnel (Checkout / Promo) | High-Velocity Low-AOV E-Commerce | | Linear | Equal distribution across all touchpoints | Medium | Mid-Funnel Nurturing | Extended B2B Consultation Cycles | | Time-Decay | Exponential weighting toward recent touches | Medium–High | Conversion Consideration Window | Subscription Renewals & High-Ticket Retail | | Position-Based (U/W-Shaped) | Heavily weights Key Milestones (30–40% anchors) | High | Multi-Stage Sales Pipeline | Enterprise B2B SaaS & CRM Workflows | | Data-Driven (Algorithmic) | Machine learning probability modeling | Very High | Full Cross-Channel Stack | High-Volume Enterprise ($10M+ ARR) |
Choosing the Right Model for Your Team
When deciding which attribution model to adopt as your primary reporting framework, evaluate your current data maturity:
- Starter Phase (Under $1M ARR): Utilize Last-Touch Attribution paired with standardized UTM tagging. Focus on establishing accurate link tracking, clean list hygiene, and consistent campaign naming conventions before attempting complex multi-touch modeling.
- Growth Phase ($1M–$10M ARR): Transition to U-Shaped Position-Based Attribution or Linear Multi-Touch Modeling. This ensures that both your initial list-building campaigns and your automated welcome flows receive proper financial recognition.
- Enterprise Phase ($10M+ ARR): Deploy Data-Driven Algorithmic Attribution integrated across your central data warehouse. Validate model output against quarterly incrementality holdout tests to measure true incremental revenue.
By aligning attribution strategy with platform infrastructure like Sendgrove Email Marketing, organizations gain full control over campaign delivery, automated audience management, and revenue reporting.
For teams conducting broader financial evaluations of their email channel, explore our companion analysis on Email Marketing ROI Attribution Best Practices.
Practical Campaign Attribution Case Study: Welcome Flow vs Promotional Broadcasts
To illustrate how different attribution models impact strategic resource allocation, let us examine three real-world campaign scenarios across e-commerce, SaaS, and B2B lifecycle marketing.
Scenario 1: E-Commerce Customer Journey

[ Day 1: Signup Popup ] ──> [ Day 2: Welcome Email #1 ] ──> [ Day 5: Retargeting Ad ] ──> [ Day 7: Promo Email ] ──> [ Purchase: $200 ]
Scenario 1: E-Commerce Customer Journey Breakdown
An e-commerce brand sells premium subscription coffee boxes valued at $200 annually. A prospect experiences five distinct interactions before completing a purchase:
- Touchpoint 1 (Day 1): Clicks a Instagram ad and signs up for a 15% discount lead magnet.
- Touchpoint 2 (Day 2): Clicks Email #1 of the automated Welcome Flow (introduces roasting philosophy).
- Touchpoint 3 (Day 4): Clicks Email #3 of the Welcome Flow (highlights customer reviews), adds a box to cart, but abandons checkout.
- Touchpoint 4 (Day 5): Clicks a retargeting ad on Facebook offering free shipping.
- Touchpoint 5 (Day 7): Clicks a flash promo broadcast email ("24 Hours Left for Free Mug") and completes the $200 purchase.
#### Revenue Attribution Comparison Across Models
- Last-Touch Model: Assigns 100% ($200) to the Flash Promo Email. The Instagram ad, Welcome Flow, and Facebook retargeting receive $0 credit.
- First-Touch Model: Assigns 100% ($200) to the Instagram ad / initial popup signup. All subsequent email automations receive $0 credit.
- Linear Model: Divides $200 equally across 5 touchpoints ($40 each). Instagram receives $40, Welcome Flow emails receive $80 combined, Facebook receives $40, and the Flash Promo email receives $40.
- U-Shaped Model: Assigns 40% ($80) to Instagram Ad (First Touch), 40% ($80) to Welcome Email #1 (Lead Opt-In Touch), and splits the remaining 20% ($40) equally across the 3 intermediate touches ($13.33 each).
#### Strategic Insight Under Last-Touch attribution, the brand would likely double down on discount flash broadcasts while defunding the Welcome Flow. However, U-Shaped multi-touch modeling reveals that the Welcome Flow built the core brand preference that enabled the promo email to convert.
Scenario 2: SaaS Free Trial to Paid Upgrade
A B2B SaaS platform offers a 14-day trial for its analytics software with an average subscription tier of $1,200/year. A lead undergoes the following journey:
- Clicks an organic search link, reads a blog guide on email metrics, and downloads a spreadsheet template.
- Receives a 4-part onboarding automation sequence explaining software setup.
- Attends a live 30-minute group product demonstration webinar.
- Receives a triggered trial expiry notification on Day 12 with a dedicated booking link.
- Clicks the trial expiry email, schedules a call with an account executive, and converts to a paid enterprise plan.
#### Revenue Credit Allocation Under a W-Shaped Position-Based Model (30% First Touch, 30% Lead Creation, 30% Sales Opportunity Creation, 10% Intermediate Nurture):
- Organic Search (First Touch): $360 (30%)
- Lead Magnet Template (Lead Creation): $360 (30%)
- Trial Expiry Notification (Opportunity Creation): $360 (30%)
- Onboarding Sequence & Live Demo (Intermediate Nurture): $120 split equally ($60 each)
This balanced distribution validates the financial return on lead generation content, automated onboarding sequences, and sales enablement outreach simultaneously.
FAQ
What is the difference between email reporting and email attribution?
Email reporting measures operational campaign metrics such as delivery rate, open rate, click-through rate, and unsubscribe rate directly within an email service provider. Email attribution measures downstream commercial impact, tracking how email interactions contribute to revenue, customer acquisition, order value, and lifetime value across the entire customer journey.
Which email attribution model is best for e-commerce brands?
Position-based (U-shaped) or time-decay attribution models are ideal for e-commerce brands. U-shaped attribution credits both the initial lead capture offer and the final checkout flow, while time-decay attribution gives higher weight to recent cart abandonment and flash sale emails that directly trigger purchases.
How does Apple Mail Privacy Protection affect revenue attribution?
Apple MPP automatically pre-loads tracking pixels via proxy servers, generating artificial open signals. This inflates open rates and breaks open-based lookback windows. To maintain accurate attribution, platforms must transition entirely to click-based tracking, first-party cookie persistence, and server-side conversion webhooks.
How to track email conversions and revenue without Google Analytics 4?
Yes. You can track email revenue by appending custom UTM parameters to outbound links, storing subscriber IDs in first-party browser cookies upon landing, and sending checkout conversion webhooks directly from your e-commerce platform or billing backend into your ESP reporting system.
How long should an email attribution lookback window be?
Lookback windows should align with your business's average sales cycle. Impulse e-commerce purchases typically use a 7-day or 14-day click lookback window. High-ticket B2B SaaS and enterprise services should use a 30-day, 60-day, or 90-day lookback window to capture prolonged multi-touch consideration periods.
How do I prevent double-counting revenue across email and paid ad channels?
To eliminate double-counting, implement a unified multi-channel attribution model in a central web analytics or data warehouse tool. Force the sum of attributed revenue across all channels to equal 100% of actual verified order revenue.